Need Help ?

Samples For "ECO 6214 : Applied Business and Economics Forecasting"

ECO 6214 : Module 2: Discussion: Trend and Seasonal Data Patterns ...

ECO 6214 : Module 2: Discussion: Trend and Seasonal Data Patterns

Introduction

This discussion will assess your ability to apply what you have learned this week using the sales data of a real company. You will also test your opinions and ideas against the ideas and opinions of your classmates.


Instructions

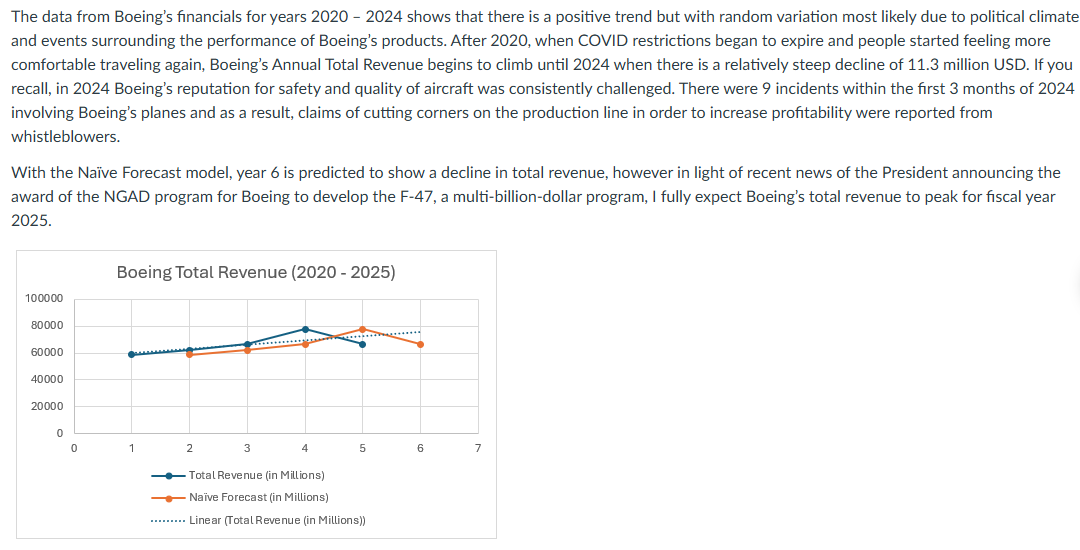
Select a corporation you are interested in and find that corporation’s annual reports for five consecutive years. Study these five annual reports and find the corporation’s total revenue (sales in dollar units) for each of those five years.

How to get sales data using Mergent online.

Perform the given tasks to prepare for the discussion:

  • Prepare a time series plot of these data (years on the x axis, sales on the y axis).
  • Use the first naive model you learned about in Week 1 to forecast data for year 6.
  • Plot the actual data along with your forecast data.

Post your graph with your answer to the given question:

  • Based on your graph of the actual data, do you think there is a trend in the data? Is there any seasonal variation? Please explain your reasoning.

Data sources and help with graphs

  • You can access the Mergent Online database using your Texas Wesleyan login information. Mergent Online contains annual reports of many public corporations.
  • The Yahoo! Finance Company and Fund Index offers company profiles, financial information, and links to a range of resources. Write the company name in the search bar and select the financials tab on the screen.
  • Watch the given video if you do not know how to plot data in Excel:

Directions

  • Make your initial post by Day 4 of this week and comment on at least two of your classmates’ posts by Day 7.
  • Post your response to the discussion and then read your classmates’ posts. Post TWO responses to at least TWO of your classmates' posts. Initial post should be no less than 150 words and no more than 450 words.
  • Discussions need to be professional. Please make proper use of capitalization and punctuation and make sure that there are no misspellings, incomplete sentences, or other grammatical errors.
  • The basic criterion for a discussion post to be considered effective is that your message is original and intelligible. You must communicate concisely and clearly.


Expert Answer

ANSWER TO : Module 2: Discussion: Trend and Seasonal Data Patterns


READ MORE >>

ECO 6214 : Assignment 1: Forecasting ...


ECO 6214 : Assignment 1: Forecasting 1

ECO 6214 : Assignment 1: Forecasting 2

Assignment 1: Forecasting

Introduction

This assignment will assess your knowledge of the concepts and techniques you have learned this week. Please answer the questions and submit your answers in a Word document.

Instructions

Submit your answers to both questions in a Word document. Download the data sets and use Excel to solve the problems.

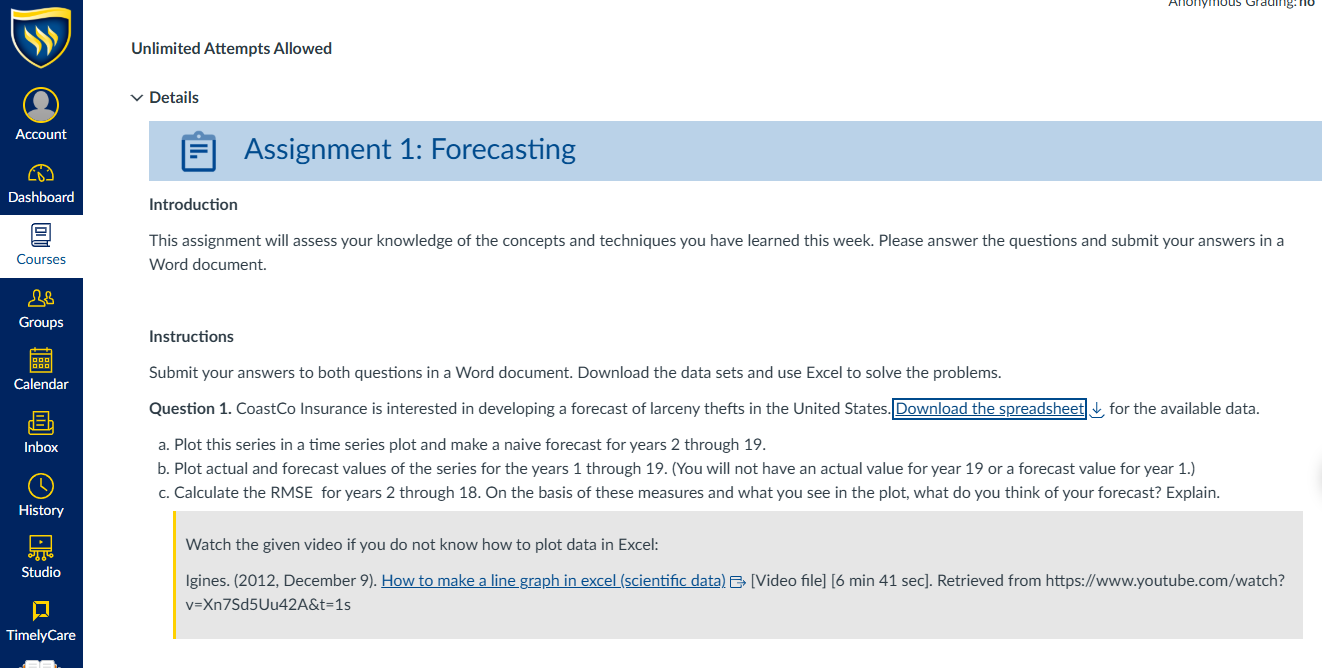
Question 1. CoastCo Insurance is interested in developing a forecast of larceny thefts in the United States. Download the spreadsheet  for the available data.

  1. Plot this series in a time series plot and make a naive forecast for years 2 through 19. 
  2. Plot actual and forecast values of the series for the years 1 through 19. (You will not have an actual value for year 19 or a forecast value for year 1.)
  3. Calculate the RMSE  for years 2 through 18. On the basis of these measures and what you see in the plot, what do you think of your forecast? Explain. 

Watch the given video if you do not know how to plot data in Excel:

Igines. (2012, December 9). How to make a line graph in excel (scientific data). [Video file] [6 min 41 sec]. Retrieved from https://www.youtube.com/watch?v=Xn7Sd5Uu42A&t=1s


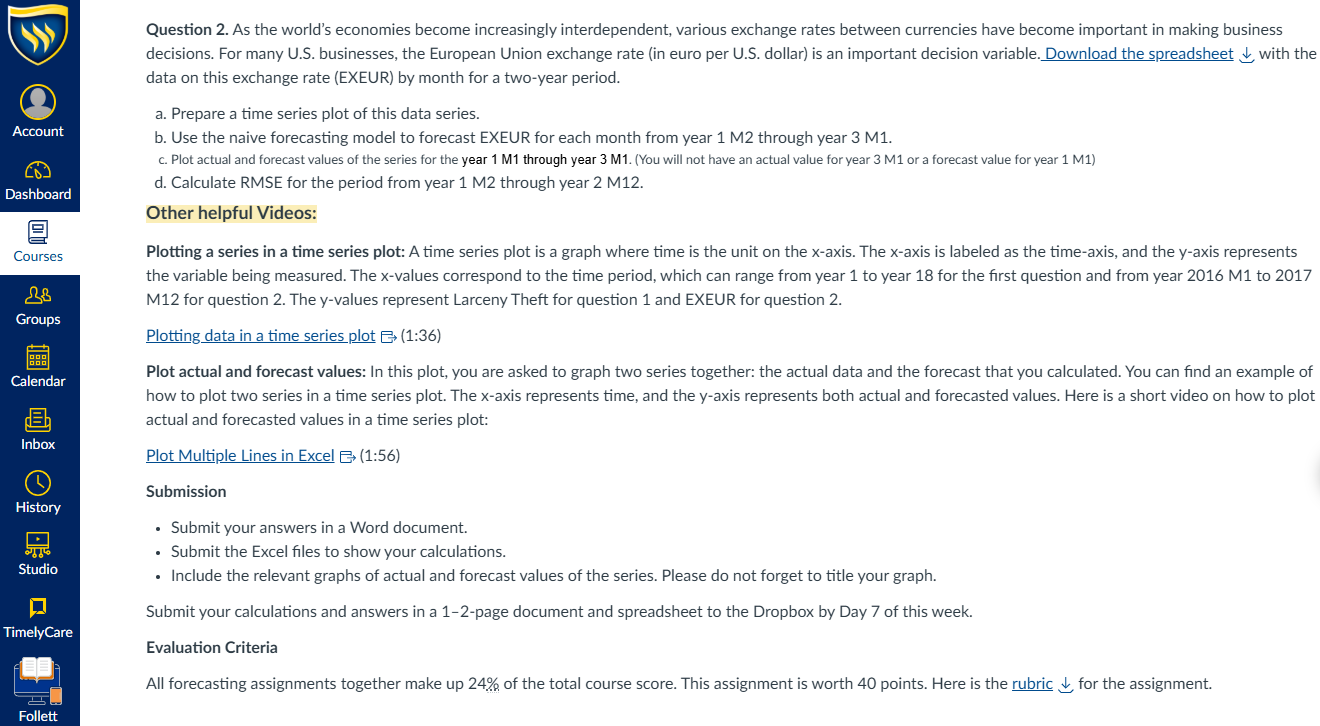
Question 2. As the world’s economies become increasingly interdependent, various exchange rates between currencies have become important in making business decisions. For many U.S. businesses, the European Union exchange rate (in euro per U.S. dollar) is an important decision variable. Download the spreadsheetwith the data on this exchange rate (EXEUR) by month for a two-year period.

  1. Prepare a time series plot of this data series.
  2. Use the naive forecasting model to forecast EXEUR for each month from year 1 M2 through year 3 M1.
  3. Plot actual and forecast values of the series for the year 1 M1 through year 3 M1. (You will not have an actual value for year 3 M1 or a forecast value for year 1 M1)
  4. Calculate RMSE for the period from year 1 M2 through year 2 M12. 

Other helpful Videos:

Plotting a series in a time series plot: A time series plot is a graph where time is the unit on the x-axis. The x-axis is labeled as the time-axis, and the y-axis represents the variable being measured. The x-values correspond to the time period, which can range from year 1 to year 18 for the first question and from year 2016 M1 to 2017 M12 for question 2. The y-values represent Larceny Theft for question 1 and EXEUR for question 2.

Plotting data in a time series plot. (1:36)

Plot actual and forecast values: In this plot, you are asked to graph two series together: the actual data and the forecast that you calculated. You can find an example of how to plot two series in a time series plot. The x-axis represents time, and the y-axis represents both actual and forecasted values. Here is a short video on how to plot actual and forecasted values in a time series plot:

Plot Multiple Lines in Exce. (1:56)

Submission

  • Submit your answers in a Word document.
  • Submit the Excel files to show your calculations.
  • Include the relevant graphs of actual and forecast values of the series. Please do not forget to title your graph.

Submit your calculations and answers in a 1–2-page document and spreadsheet to the Dropbox by Day 7 of this week.


READ MORE >>

ECO 6214 : Module 1, Discussion: Qualitative and Quantitative Forecasting Method ...

ECO 6214 : Module 1, Discussion: Qualitative and Quantitative Forecasting Methods
ECO 6214 : Module 1, Discussion: Qualitative and Quantitative Forecasting Methods


Introduction

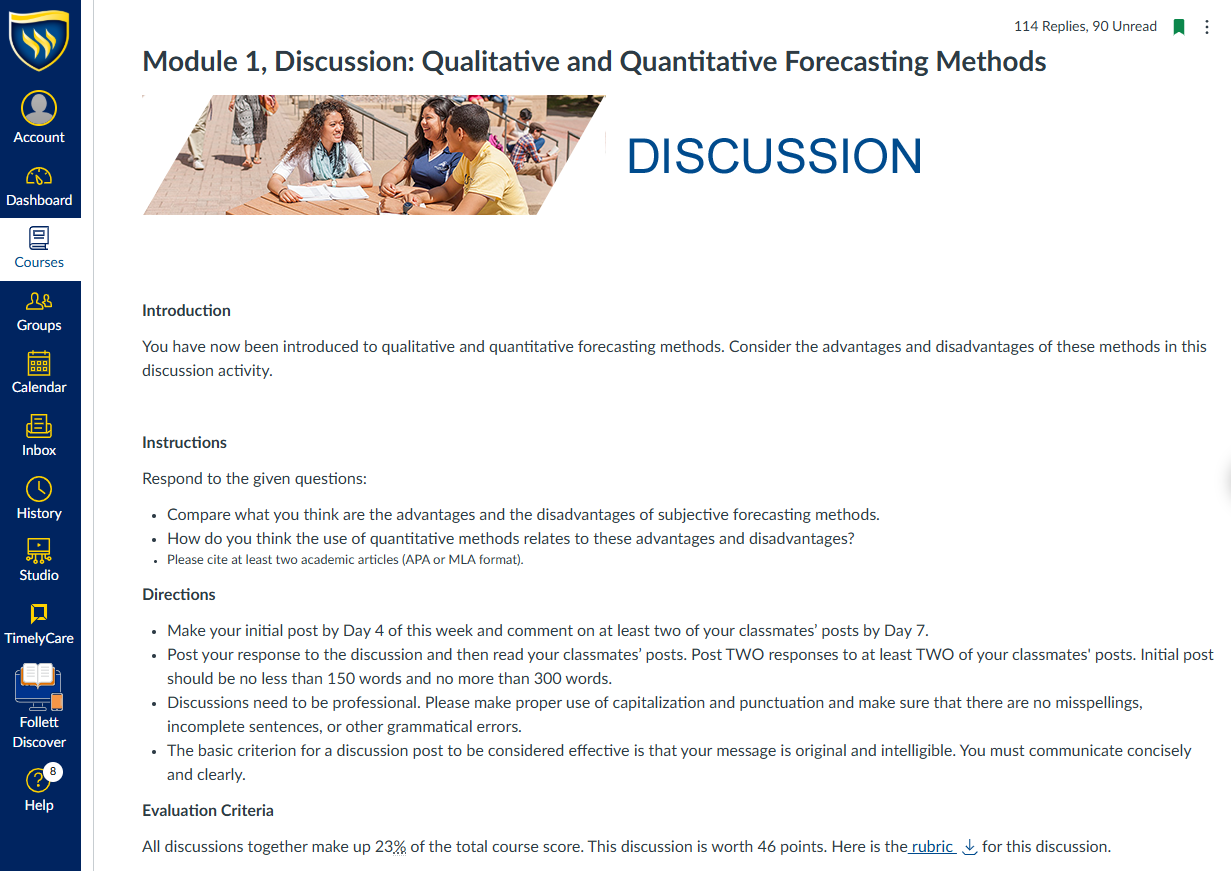
You have now been introduced to qualitative and quantitative forecasting methods. Consider the advantages and disadvantages of these methods in this discussion activity.

Instructions

Respond to the given questions:

  • Compare what you think are the advantages and the disadvantages of subjective forecasting methods.
  • How do you think the use of quantitative methods relates to these advantages and disadvantages?
  • Please cite at least two academic articles (APA or MLA format).

Directions

  • Make your initial post by Day 4 of this week and comment on at least two of your classmates’ posts by Day 7.
  • Post your response to the discussion and then read your classmates’ posts. Post TWO responses to at least TWO of your classmates' posts. Initial post should be no less than 150 words and no more than 300 words.
  • Discussions need to be professional. Please make proper use of capitalization and punctuation and make sure that there are no misspellings, incomplete sentences, or other grammatical errors.
  • The basic criterion for a discussion post to be considered effective is that your message is original and intelligible. You must communicate concisely and clearly.


Expert Answer

Subjective forecasting methods can be valuable, especially when there is insufficient data to rely on. One of the most significant benefits is their flexibility—experts can adjust their forecasts based on new information or sudden changes, something quantitative methods can struggle with if there is no historical data to work from. These methods also bring in the insight of people with deep knowledge of the subject, which can be critical in situations where things are uncertain or complex to predict.
That said, subjective forecasting is not without its flaws. It is highly vulnerable to biases, like overconfidence or personal experience, which can skew predictions (Sharma, 2024). Unlike quantitative methods, measuring how accurate a subjective forecast is is complex, making it hard to trust in high-stakes scenarios.
Quantitative methods, on the other hand, are more reliable when there is solid data to work with. They are objective and consistent, which makes them great for stable situations (Verhoef & Casebeer, 1997). However, they can miss the bigger picture, especially in unpredictable environments or when qualitative factors matter. Ultimately, combining both approaches can often be the best way to go. Quantitative methods provide a data-backed starting point, while subjective insights can help fill in the gaps and adjust for the unknowns that data cannot always predict.

References:

1.  Sharma, G. (2024, March 19). Optimizing demand forecasting: Challenges and best practices. Institute for Supply Management. https://www.ismworld.org/supply-management-news-and-reports/news-publications/inside-supply-management-magazine/blog/2024/2024-03/optimizing-demand-forecasting-challenges-and-best-practices/Links to an external site.

2. Verhoef, M. J., & Casebeer, A. L. (1997, March). Broadening horizons: Integrating quantitative and Qualitative Research. The Canadian journal of infectious diseases = Journal canadien des maladies infectieuses. https://pmc.ncbi.nlm.nih.gov/articles/PMC3327344/Links to an external site.

3. Wilson, J. H., & Keating, B. (2018). Forecasting & predictive analytics: With ForecastX. McGraw-Hill/Irwin.

READ MORE >>
WhatsApp